
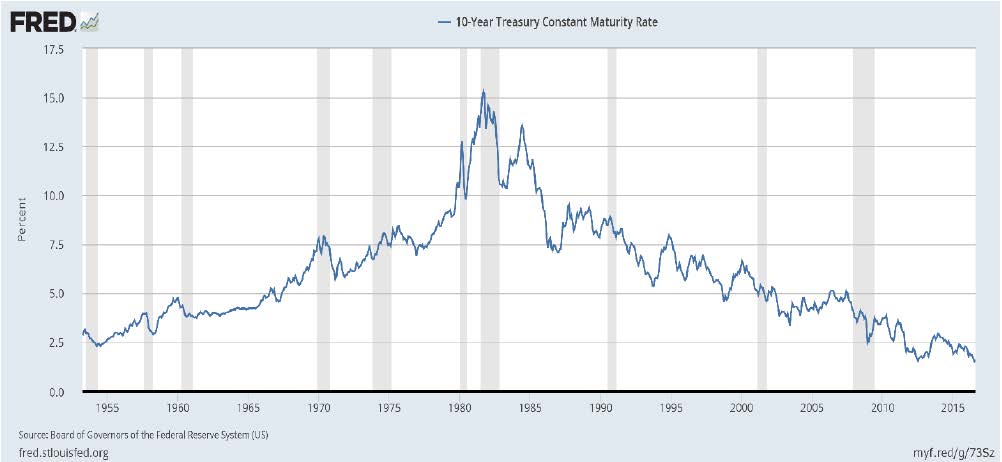
We have expressed our concerns with the bond markets, specifically the negative rates being experienced around the globe as central banks attempt to boost economic activity through low rates. These actions have taken a toll on the increasing number of retirees that had depended on the income from their savings as they have seen the “riskless” government bonds go from 5%+ to less than 1%. It also, from our perspective, has not accomplished the goal of increased economic investment and the recovery to pre-2008 global economic growth. And in recent weeks, we have heard an increasing number of economists and central bankers note that the unintended consequences of artificially low rates may be doing more harm than expected.
With the heightened awareness coming to the market that we may be at the beginning of a rate cycle, the questions that hit us as most important are: i) how much will rates rise, ii) how fast will they adjust, and iii) who is most impacted.
There is a rule of thumb when it comes to interest rates that may assist us in coming to some answers. To be clear, with any rule of thumb, we need to state unequivocally that they are imperfect and are not ‘laws.’ No one will be jailed if they are broken, though history suggests that thinking that ‘this time is different’ can dramatically hurt one’s ego and wallet!
The rule of thumb is short term treasury interest rates (typically the 2-year bond is used) should be tied to the level of inflation experienced. The explanation is idle money should not decline in value, in real terms, over a short amount of time. In order for that to be true, the rate of return on idle money should equate, roughly, to expected and experienced inflation. Throughout time, there has been a link, albeit loose, between the two. For a long part of history, the ratio, as shown on the following page, has centered around 1.5x – meaning that short term rates have typically been about 1.5 times the amount of inflation experienced. This rough average existed for the first 20 years of the current cycle, but dropped to approximately 1.0x in the early 2000’s. Since the 2008 timeframe, this ratio has dropped further to a level where one is now losing money to inflationary pressures rather than maintaining or growing purchasing power.
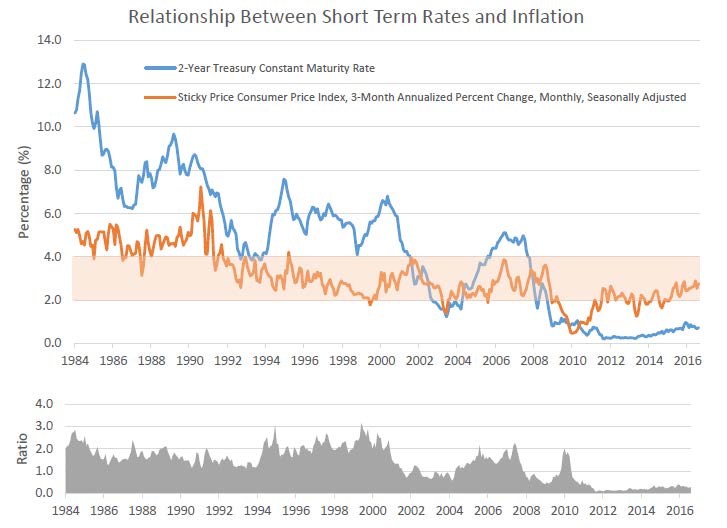
The conclusion one can draw from this is that either inflation needs to fall or rates need to adjust up. With wage pressures starting to come into play, it appears more likely that rates will need to move up. To get back to historical levels, we would need to see short term rates adjust from the current 0.87% to a level closer to 3.0%. That would be a significant adjustment for the market to absorb. In an attempt to soften what looks like such an extremely large increase, there are a number of unknowns that make the error bands around it quite large. However, it does indicate how much movement we could see before we even get back to historical levels.
As it pertains to the second question, how fast it will take to get to a “normal” level, there is little history or wisdom that can be used to get a firm grip on that. What we find interesting is when looking at inflation, as depicted in the chart above, we have spent most of the last 4 years bumping around the bottom of what has been a historical range of this measure of inflation. If central banks were to give up on the idea of monetary easing, the weight that has been placed on rates would be removed and the movement in rates would be swift. There is a consensus that rates will be lower for longer, however, we (the collective we) tend to be anchored to what we are currently experiencing. With data increasingly pointing to a recovery of inflationary pressures, the line holding on to the anchor may be close to breaking.
There is little doubt that if such a swift move were to occur that the world’s markets would have to adjust. The question then becomes what would be impacted the most. In most cases, the prospect of rising rates drives the thought towards the end of an economic cycle and the increasing probability of recession. It lends itself to typically favor those areas that can weather sluggish economic growth. However, that may be different from what we will initially experience as the first phase of a potential rate rise would be to a point of normalization rather than a stifling of economic activity.
If that were to be the case, those that have been benefitting the most with rates below their natural level would be the likely victims. Those also tend to be the most heavily indebted, or the most dependent on low cost debt. Utilities, real estate, basic materials, and financials may be the ones that are hardest hit as funding becomes more expensive. Interesting enough, those industries have been the ones where investors have gravitated towards in their search for yield and safety.
Conclusion
The incredible rebound seen over the last six months has created increasing anxiety that we are close to an unstable position within the investment world. With the binary elements facing the world (the US elections, health of many European banks, interest rate increases), the anxiety is understandable. Yet, we are reminded of Peter Lynch’s well-worn quote “Far more money has been lost by investors preparing for corrections, or trying to anticipate corrections, than has been lost in corrections themselves.” Our signals continue to suggest a mid-cycle investment environment. The anxiety displayed in headlines, so far, are not expressing themselves in our risk factors. We remain diligent in our search for a heightened risk environment that would cause us to move further into a defensive position but, at this point, the global markets appear to be dealing with the anxiety well.