
Summer has officially begun. Humidity is rising on the East Coast. The Pacific Northwest is hitting temps we have never seen before. Sunburns are fading into tans. With summer hitting its stride, then, we will keep this note short…
We love what Mark Twain said about speculation: “There are two times in a man’s life when he should not speculate: when he can’t afford it, and when he can.” Defining speculation within the context of investing can be difficult, but we tend to think you know it when you see it. We have discussed market speculation some over the past year or so, but in this newsletter we highlight some charts that show some interesting signs that speculation is having a real effect.
Let’s start by looking at U.S. household allocation to the equity markets—arguably the riskiest way for households to save money. Equities have shown themselves to provide strong long-term returns, but they come with volatility. The graph below charts the historical swings we have seen in households’ exposure to equities, with the highest exposures being near or at the top of market movements.
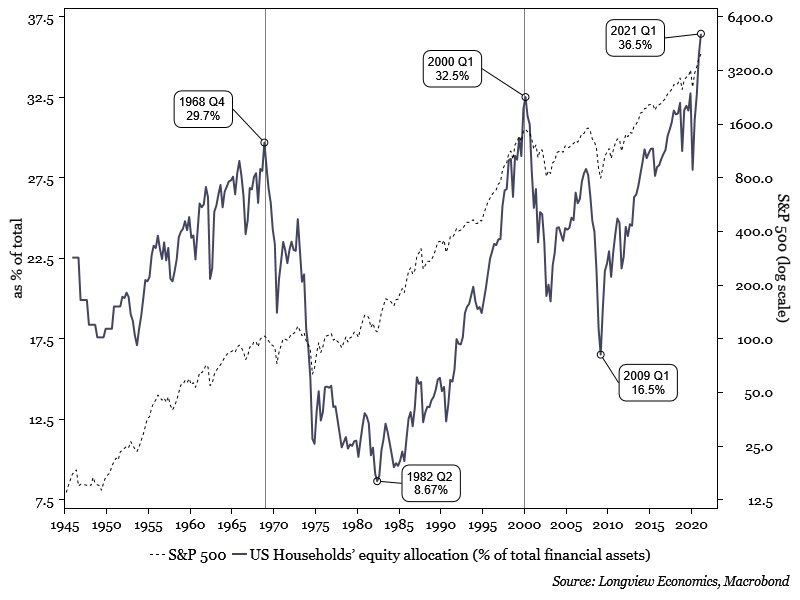
One could have argued that the allocation was extreme in 2018 and 2019, so this is perhaps not a good short-term or intermediate metric, but if you take the longer view, it demonstrates the cyclical nature of investor confidence, which certainly looks very confident right now.
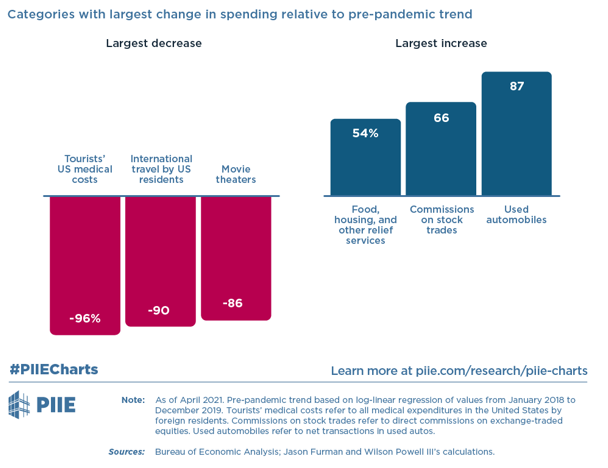
Arguably, speculative time periods in the investment markets have coincided with periods where there has been considerable public attention paid to the markets. We won’t argue for causation versus correlation, but we were struck by the below graphic from the Peterson Institute highlighting consumer spending habits now versus the period prior to the pandemic. It should not come as a surprise that travel and group entertainment activities were hit the hardest. But what we had not expected was for the second largest category of increased spending to be commissions on stock trading. More and more people are paying attention to the investment markets, and with an eye toward getting rich quick. Traditionally, that has not been a winning long-term strategy.
We are firm believers in the law of supply and demand. As demand rises, supply will attempt to keep up. One example: if the prices of autos are increasing due to added demand, auto suppliers will ramp up production in their attempt to satisfy it. Investment markets are no different. The chart below shows the activity in companies looking to raise capital (measured as a percent of GDP). To meet the hunger for equities, equity issuance has achieved a level that surpasses that experienced during the dotcom bubble.
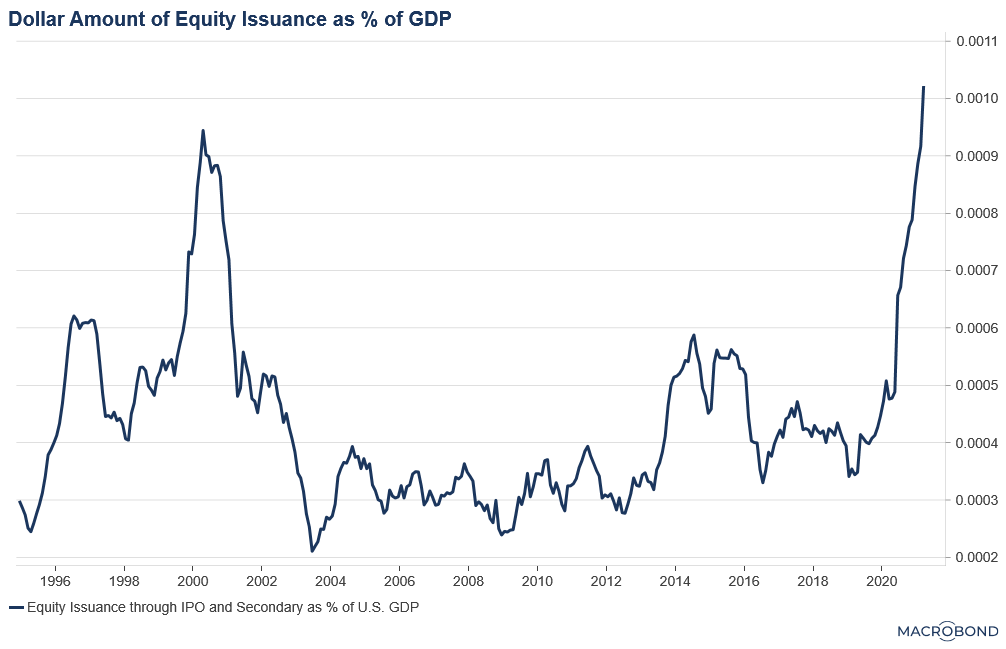
Of course, the increase in equity issuance could suggest a robust offering of new companies, a culmination of their past innovative efforts that have now reached a point of maturity, allowing the companies to move to the next stage of corporate life.
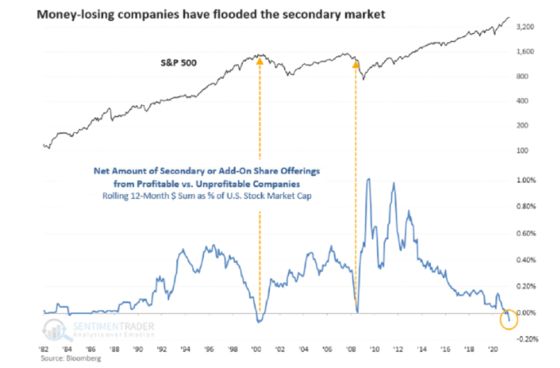
However, the graph below suggests a different story. The lower section of the chart tracks the aggregate profitability of those companies raising capital via the public markets. Over the past 40 years, it has been very infrequent to have the aggregate of those companies issuing equities be unprofitable; such an effect is only seen near the tops of past periods of exuberance.
So, what do we take from this?
Linda Raschke, a well-known equity trader, states quite nicely a lesson we take firmly to heart: “The most difficult task in speculation is not predicting but self-control. Successful trading is difficult and frustrating. You are the most important element in the equation of success.”
We don’t advocate speculating in the investment markets but, as long-term investors, we will be exposed to speculators that invade markets hoping for quick gains. Now is a time for self-control.