
The world’s addiction to low interest rates reminds us of the Sirens of Greek mythology who allegedly (never convicted) inhabited an island between Aeaea (and you thought Auour had a lot of vowels) and the rocks of Scylla. Their sweet songs (low interest rates) attracted sailors (borrowers), only to lead them and their ships to rocky ruins—OK, that may be a bit too dire. No matter, populations around the globe have become accustomed to modest inflation and ever lower interest rates. As we recently have written, however, this low inflationary environment may be behind us, with a period of high inflation and rising rates coming over the bow.
Let’s start with the idea that inflation is not fleeting, as hoped, but rather it’s becoming embedded in the economy. In our recent newsletter, we discussed the events leading to scarcity, and, we argued, they appear to be driven more by structural causes than by the money-supply. (Money supply has played a large role, but we think it merely amplified the underlying structural issues.) We sit in an unstable position, then, if you believe history is to be respected.
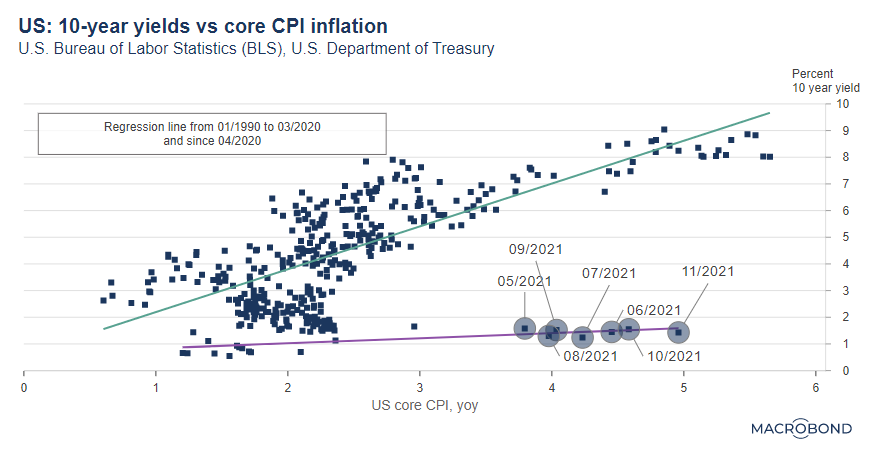
The chart above highlights this instability. The green line shows the long-term historical relationship between inflation and interest rates. The purple line depicts the same relation only for the period encompassing the pandemic. Even if you believe inflation (shown as “core CPI,” on the x axis) is only temporarily elevated, it still argues for a 200bps adjustment in the 10-year Treasury note—from its current 1.8% interest rate to something around 4%. (As an aside, interest rates on mortgages are traditionally tied to the 10-year Treasury interest rate. Could you imagine a world where mortgages were in the 5% to 6% range?)
The distortion is, as has been well-publicized, driven by the world’s central banks pushing down rates. They do so by purchasing government bonds as a means of propping up prices, which lowers interest rates. Their influence is demonstrated in the declining share of sovereign debt held in the hands of private investors, who traditionally are the natural buyers of fixed income instruments.
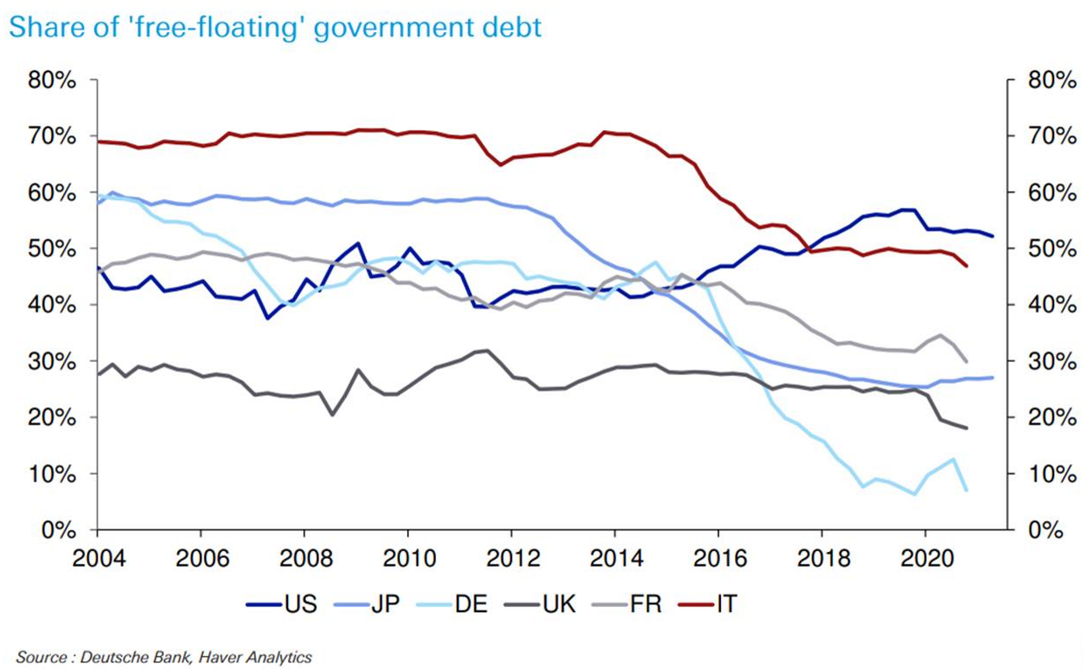
Global central banks outside the U.S. have been about the only buyers of sovereign debt for the past decade, blurring the distinction between central banks and political bodies. This suggests one of two paths: that central banks will stop buying sovereign debt, letting the private markets once again control the price of that debt and letting risk-free rates move to market-determined levels; or, that political will wins, central banks lose their independence, currencies risk their value retention and inflation continues to run hot.
Central banks, through their massive buying of debt, have created a blackhole in risk-free rates, drawing all income-producing vehicles into that hole. If central banks need to give up on an easy monetary environment to fight inflation, rates across all income-producing products will increase, leaving little opportunity for fixed-income instruments to appreciate. This has some market strategists arguing that more equity within a portfolio is necessary. However, in our view, that comes with its own set of risks.
 The first among such risks is over-valuation.
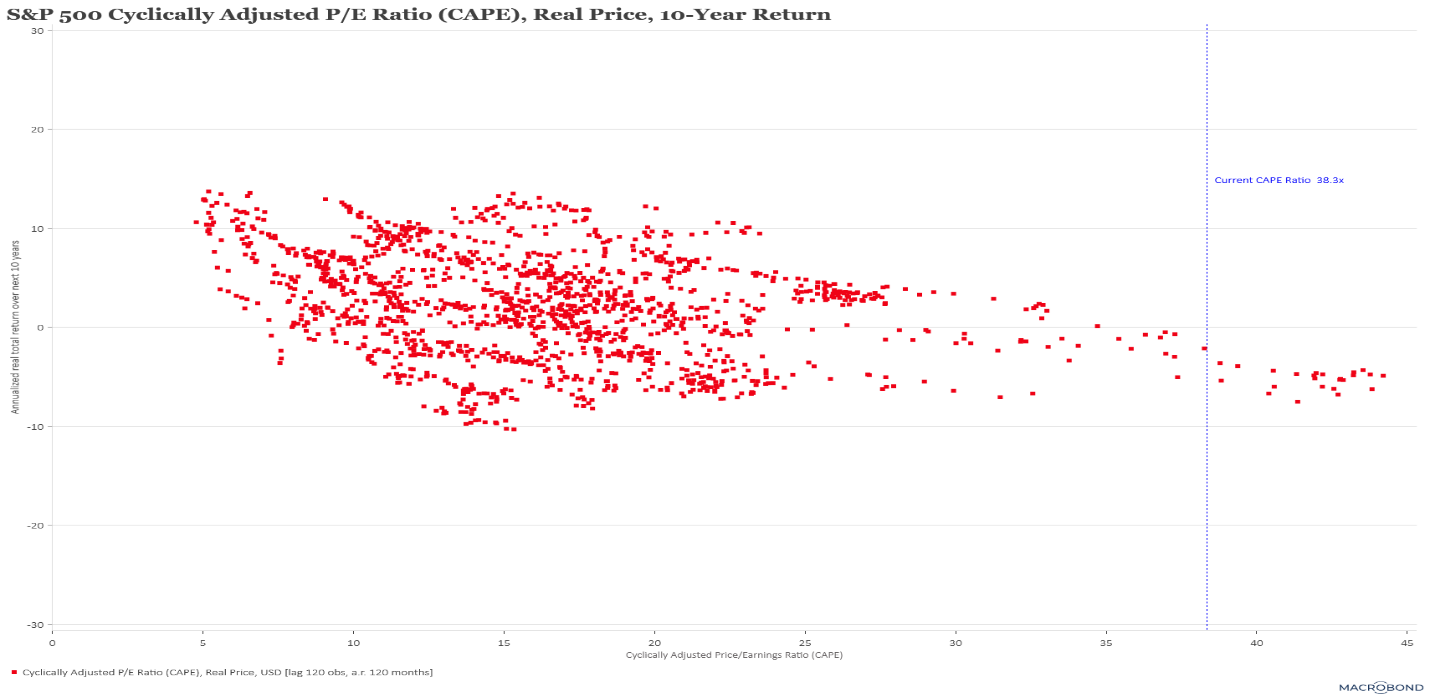
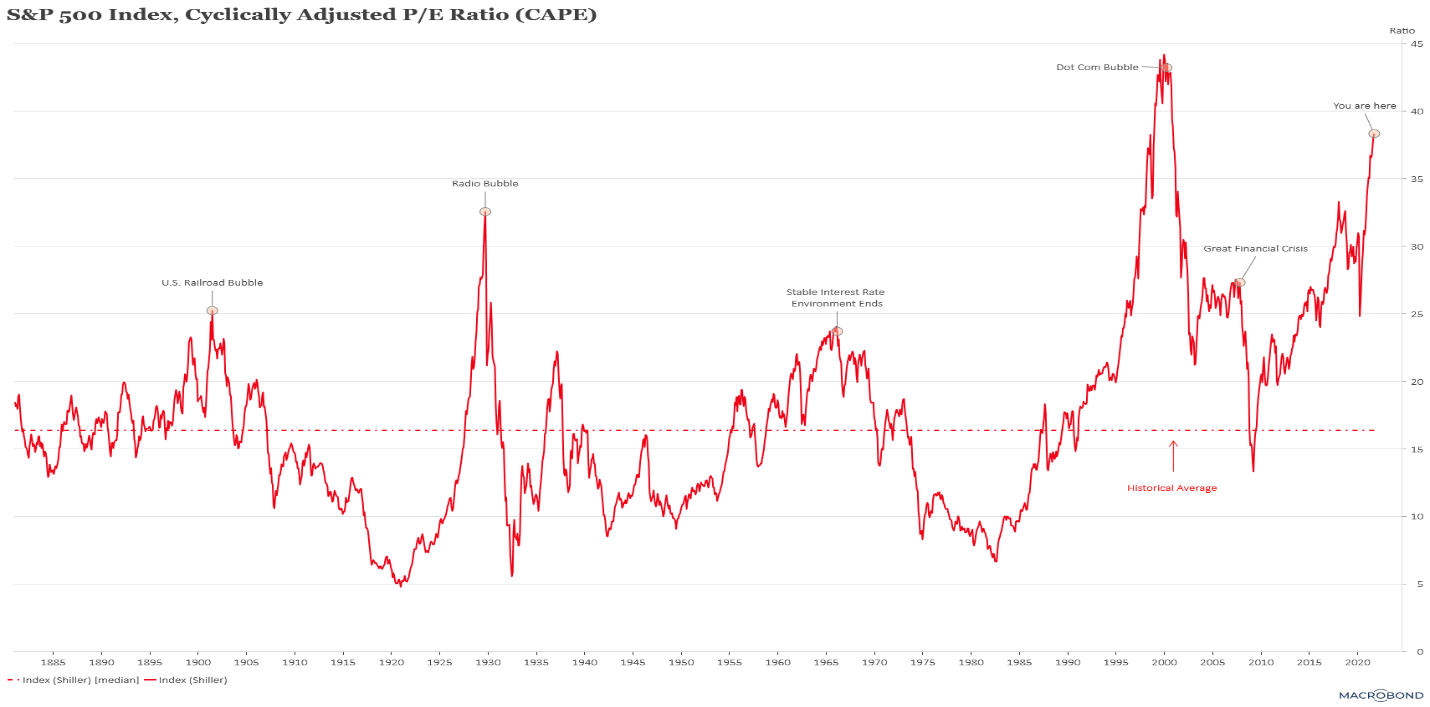
No matter what metric you choose to measure equity values now, we are seeing historically high valuations. The above chart highlights the CAPE (cyclically adjusted price to earnings) ratio, which is horrible at predicting timing, but good at demonstrating severity when (not if) market participants return their focus to values-based investing. While it is true that the future might be different in unknowable respects from the past, the last 100 years of data should humble us all. The chart below looks at 10-year forward returns versus experienced CAPE. All 10-year forward returns from valuation levels near what we are seeing today have been negative. This is also true for 5-year forward returns. (These last two charts should look familiar because we have presented earlier versions before, and they continue to become even more extreme with updated data.) Extremes typically last longer than many expect, but that doesn’t make them any less extreme.
We are not arguing to avoid equities completely. Instead, we are highlighting the need for caution. The 10-year returns following high CAPE periods of the past come mostly from the dotcom bubble, and a few data points are from the late-1960’s. Many of us are not old enough to remember the 1970’s—the period that returned to valuation sensitivity, but a lot of us remember the 2000’s quite well. We do not see the same disparities in valuations as we did during the dotcom period. The dotcom bubble was localized in technology and communication companies, and during that period one could buy tobacco company stocks with double-digit dividend yields and industrial companies at single-digit earnings multiples (i.e., really, really cheap). Not today. The low interest rate environment and the central bank blackhole have brought almost every asset category to historically high valuations.
We sometimes hear that low interest rates drive a lower risk premium and therefore a higher normalized valuation level. But this has only been true over the past 40 years, in the presence of low inflation when rates were normalizing after the Volker period. If inflation persists and rates move higher, history suggests rather that valuations will drop, even for growth companies, a phenomenon the U.S. experienced in the 1970’s.
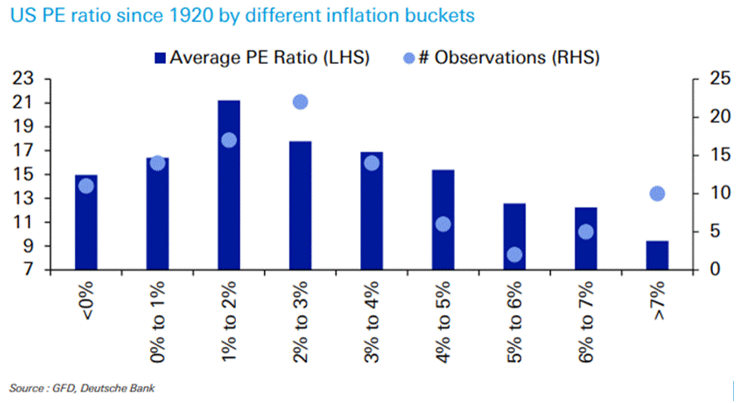
If inflation picks up, the graph below does not auger well for valuation levels. A negative relationship between P/E (price to earnings valuation) and inflation has existed for the last 100 years. The higher inflation is, the lower the valuation multiples are that the markets will pay for equities.
The question comes down to the path investors take to get to those lower valuations. In some cases, it is through companies growing their earnings into a more reasonable valuation. In others, it will be a resetting of prices to reflect a more modest growth in earnings. The latter is already showing itself in those companies that benefited from the pandemic as some of the benefactors have seen drops of 50-80% from their highs. No matter which, history suggests that the path taken will not be without volatility.
Conclusion
Though valuations can become anchored, making any normalization to historical averages take time, we suspect we will see periods that resemble the shorter corrections (i.e., one- to three-quarter long corrections, not multi-year ones) we have experienced over the past 10 years. Our suspicion lies in the complacency within the investment markets. This complacency has led to high leverage as many believe that central banks will defend assets prices rather than follow their overarching mandate to protect price stability.
If that is not the case and central banks prioritize price stability above all else, it will put significant pressure on those that have leveraged bets to the contrary with the result being margin calls. Correlations of all assets drive towards one when margin is called, fear takes hold, and people run for the exits.
We sit with a 20% allocation to cash across our strategies, expecting better opportunities to move back into a fully invested position.