
In our first note of the year, we said patience would be required as the world worked through high inflation and tightening monetary conditions. We suggested that the last 20 years have conditioned investors to assume economic events happen quickly and resolve quickly. We cautioned that this time may be different from the recent past—that this time, it might take longer to work excesses out of the system and return to a more normal level of inflation.
Over the past year, many have worried the aggressive hiking cycle by central banks would push us into a recession. Well, it has been one year, and no signs of a recession are in sight. In a recent Bank of America survey, most global fund managers think we will now have a soft landing or no landing at all. Perhaps they think we are in the clear because the central banks have been aggressive, and nothing has happened yet.
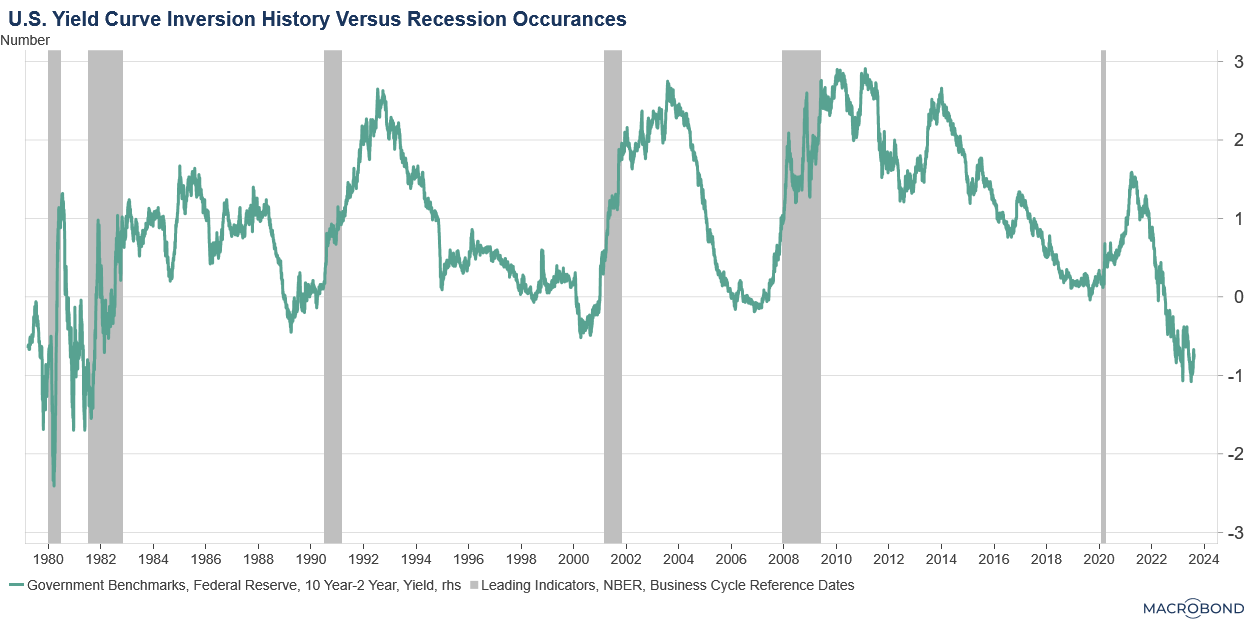
Over the past 40 years, every time the 2-year Treasury note has yielded more than the 10-year bond (known as an “inverted yield curve”), the U.S. experienced some level of economic contraction. The chart above depicts this phenomenon, and you can see a recession (shaded areas) occurred every time the green line (the 2-year rate minus the 10-year rate) became negative. We currently sit with the most significant inversion since the early 1980s. It seems odd to think that if we haven’t had a recession yet, we are now somehow past the point of being susceptible to one, but that is the growing consensus.
In 2022, we shared work by Deutsche Bank looking at the time between a yield curve inversion and the start of a recession. The results varied greatly, with the average time being about 17 months. Our current inversion started in March of 2022, so, based on that average, we could expect a recession in the next month or so. Of course, averages are not predictive, and this is not a forecast. The considerable variability in historical downturns (ranging from eight months after an inversion to 45 months) should produce no confidence in anticipating the next.
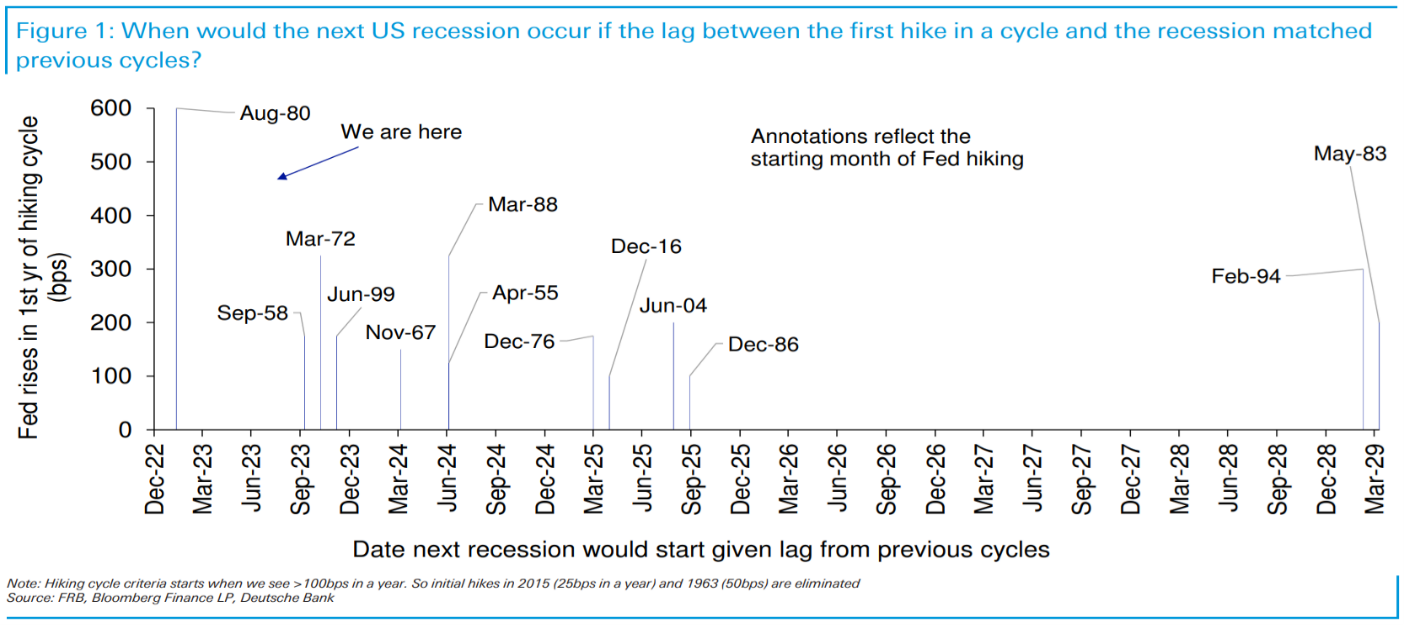
Deutsche Bank also examined the potential for a recession from another angle, asking: Does analyzing the onset of previous rate increase periods and the subsequent time to a recession reveal a pattern that could help anticipate the next downturn? The chart below plots past occurrences as if they occurred when our current rate hike cycle began so we can see how long it took for a recession to occur. For example, the interest rate cycle that started in March 1972, had it started when our current rate hike began, would suggest the start of a recession in October 2023. Using this pattern, the earliest we might have expected a recession would have been the beginning of this year (if our current situation mimicked the August 1980 cycle), and the latest we might have expected it would be in early 2029 (mimicking the May 1983 cycle). However, most events in the pattern cluster between the end of this year and 2025. These analyses are obviously not precise and should not be relied on for making a prediction.
The above two charts show us it is optimistic to assume that, since we haven’t had a recession yet, we won’t have one. In fact, the data suggest that a recession was not a high probability until now.
 It is only now that we appear at the time of greatest susceptibility to a recession, based on history. So, is now the time to be scared and highly defensive? Our risk signals do not suggest anything is imminent, which explains why we sit with little dry powder within our investment strategies. We think there are some fundamental reasons why our risk measures are constructive.
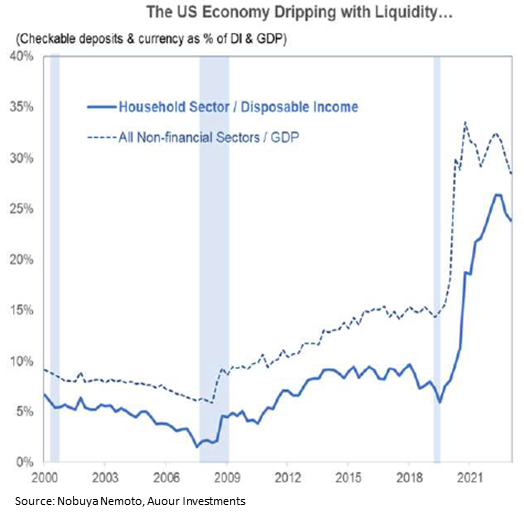
Let’s start by looking at the savings rate in the U.S. economy. The adjacent graph illustrates cash relative to the gross domestic product in the economy. Pandemic-related stimulus efforts markedly increased savings, aiding consumer spending and economic growth. Though the amount of extra savings has diminished in the past few quarters, it remains historically elevated. This indicates that consumer spending might remain robust as individuals draw down these additional savings. Considering our economy’s strong reliance on consumption, it would not be surprising to see robust economic performance until the savings level reverts to its historical norm.
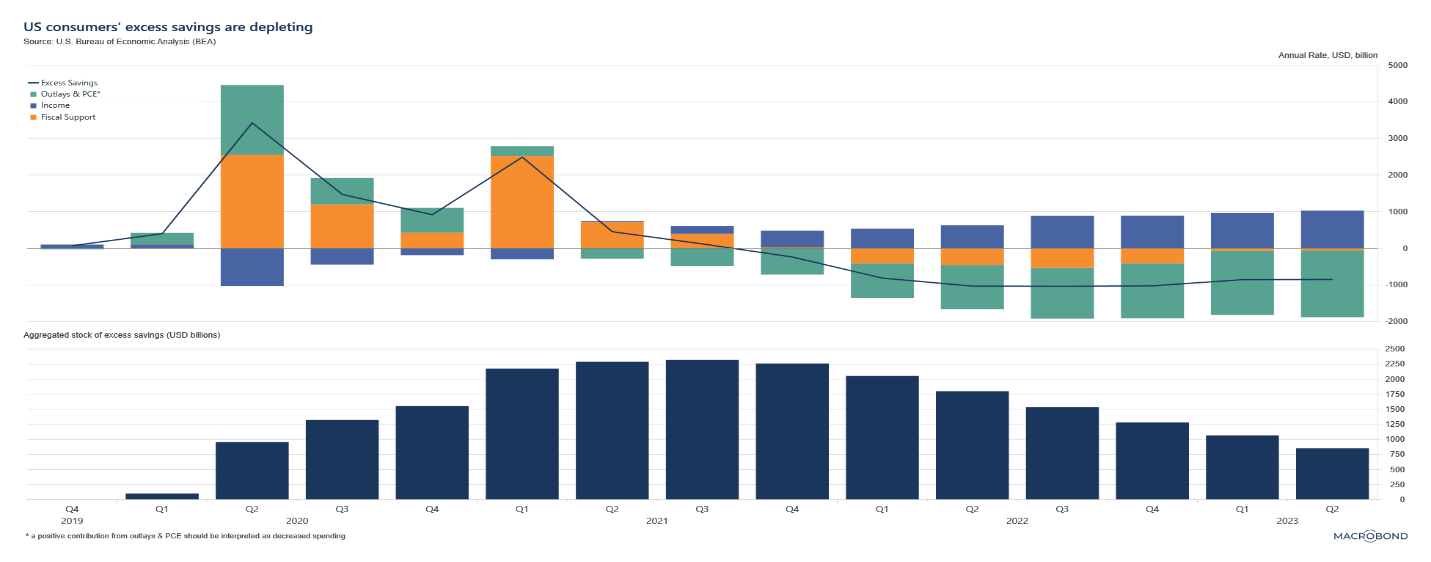 How long will that be? The two charts in the figure below help with that question. They show, on a quarterly basis, how fast the excess is being spent. The top chart shows the composition of consumer savings since the pandemic. The orange bars represent the large fiscal stimulus placed into the system, while the green bars identify consumer spending. Consumers have been spending more than they have made in income (blue bars), made possible by their higher savings. The bottom chart shows the working off of that excess savings. We still have a way to go, but a sizable dent has been made in savings accounts.
Likely because consumers with full pockets are still spending, companies have continued to need employees, leaving unemployment near the bottom of its historical range. It would be a first if we had a recession while still at full employment. Therefore, let’s try to assess what will be needed to see unemployment rise.
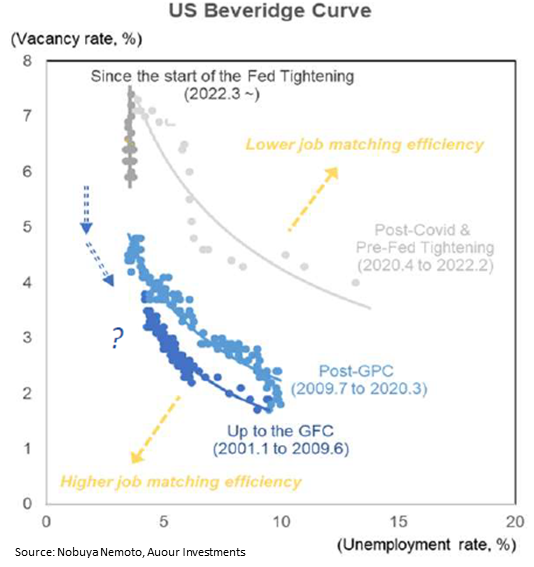 The nearby chart shows the relationship between unemployment and the current demand for labor. Known as the Beveridge Curve, the chart plots the job vacancy rate (job openings as a percentage of all jobs) on the vertical axis and the unemployment rate on the horizontal axis. The light gray grouping of data points depicts the period after the pandemic when we experienced relatively high job vacancy levels, with high levels of unemployment. During that time, there was a mismatch between those looking for work and available jobs, causing the curve to push out compared to more normal times (depicted by the grouping of points in blue). The dark gray dots are nearly vertical, showing the change in job openings has not yet impacted unemployment. If we are moving back to a more normal environment, it could be argued we will need to see continued declines in job openings before we see any impact on unemployment. And with little job loss, it would be difficult to see a strong headwind to consumer spending and economic growth.
The above commentary highlights several reasons why we have yet to experience the economic contraction many have been anticipating. But, just because we haven’t experienced a recession yet does not mean one will not occur. We have often said that at Auour, we aim to go around economic storms by holding higher levels of cash. Earlier in the year, we mentioned that we were pivoting back into the market, riding the edge of the storm. We continue on that path, watching for darker clouds before we move into a deeper level of defensiveness.